Snacks salés
Fait partie de :
Contient :
Tableau nutritionnel
Composition nutritionnelle moyenne pour les 11206 produits de la catégorie Snacks salés dont les informations nutritionnelles sont connues (sur un total de 11696 produits).
| Tableau nutritionnel | Tel que vendu pour 100 g / 100 ml |
Ecart type | Minimum | 10ème centile | Médiane | 90ème centile | Maximum |
|---|---|---|---|---|---|---|---|
| Énergie |
1 850 kj (443 kcal) |
466 kj (110 kcal) |
0 kj (0 kcal) |
845 kj (206 kcal) |
2 010 kj (480 kcal) |
2 330 kj (556 kcal) |
8 040 kj (1920 kcal) |
| Énergie provenant des graisses |
522 kj (125 kcal) |
306 kj (73 kcal) |
35 kj (8 kcal) |
188 kj (45 kcal) |
652 kj (156 kcal) |
1 120 kj (268 kcal) |
1 790 kj (428 kcal) |
| Matières grasses | 22,7 g | 10,1 g | 0 g | 6,9 g | 23 g | 37 g | 100 g |
| Acides gras saturés | 4,01 g | 3,15 g | 0 g | 0,9 g | 3 g | 11 g | 61,8 g |
| Acides gras monoinsaturés | 16 g | 8,8 g | 0 g | 3,57 g | 16 g | 28 g | 36 g |
| Acides gras polyinsaturés | 4,71 g | 3,94 g | 0 g | 1,4 g | 3,5 g | 14,7 g | 30 g |
| Acides gras trans | 0,005 g | 0,026 g | 0 g | 0 g | 0 g | 0 g | 3 g |
| Cholestérol | 1,63 mg | 5,48 mg | 0 mg | 0 mg | 0 mg | 17 mg | 107 mg |
| Glucides | 46,1 g | 18,2 g | 0 g | 9 g | 51,7 g | 67,9 g | 385 g |
| Sucres | 3,17 g | 2,45 g | 0 g | 0,5 g | 2,5 g | 7,7 g | 83,3 g |
| Sucres ajoutés | 2,61 g | 4,25 g | 0 g | 0 g | 0 g | 14,3 g | 14,3 g |
| Fibres alimentaires | 4,2 g | 2,16 g | 0 g | 1,1 g | 4 g | 8,6 g | 77 g |
| Fibres solubles | 0,167 g | 0,373 g | 0 g | 0 g | 0 g | 1 g | 1 g |
| Fibres insolubles | 0,118 g | 0,322 g | 0 g | 0 g | 0 g | 2 g | 6 g |
| Protéines | 8,4 g | 4,01 g | 0 g | 3,6 g | 7 g | 16,8 g | 74 g |
| Sel | 1,48 g | 0,558 g | 0 g | 0,7 g | 1,4 g | 2,5 g | 520 g |
| Alcool | 0 % vol | 0 % vol | 0 % vol | 0 % vol | 0 % vol | 0 % vol | 45 % vol |
| Vitamine A (rétinol) | 16 µg | 40,9 µg | 0 µg | 0 µg | 0 µg | 107 µg | 1 500 µg |
| Vitamine D | 0 µg | 0 µg | 0 µg | 0 µg | 0 µg | 0 µg | 0,353 µg |
| Vitamine E (tocophérol) | 6,6 mg | 2,16 mg | 2 mg | 3 mg | 8 mg | 8 mg | 10,7 mg |
| Vitamine C (acide ascorbique) | 2,56 mg | 5,86 mg | 0 mg | 0 mg | 0 mg | 21,1 mg | 42,9 mg |
| Vitamine B1 (Thiamine) | 0,346 mg | 0,371 mg | 0 mg | 0 mg | 0,32 mg | 1 mg | 15 000 mg |
| Vitamine B2 (Riboflavine) | 0,33 mg | 0,221 mg | 0 mg | 0,06 mg | 0,39 mg | 0,6 mg | 1,58 mg |
| Vitamine B3/PP (Niacine) | 4,94 mg | 2,37 mg | 1,2 mg | 1,3 mg | 5,33 mg | 10 mg | 16,8 mg |
| Vitamine B6 (Pyridoxine) | 0,343 mg | 0,257 mg | 0 mg | 0,02 mg | 0,32 mg | 0,8 mg | 1,58 mg |
| Vitamine B9 (Acide folique) | 1 760 µg | 9 380 µg | 0 µg | 0 µg | 80 µg | 155 µg | 80 000 µg |
| Folates (folates totaux) | 94,8 µg | 68,3 µg | 16 µg | 19 µg | 133 µg | 194 µg | 268 µg |
| Vitamine B12 (cobalamine) | 0 µg | 0 µg | 0 µg | 0 µg | 0 µg | 0 µg | 2,5 µg |
| Potassium | 353 mg | 278 mg | 0 mg | 75 mg | 284 mg | 1 000 mg | 35 700 mg |
| Calcium | 73 mg | 76,3 mg | 0 mg | 0 mg | 50 mg | 240 mg | 1 140 mg |
| Phosphore | 200 mg | 129 mg | 0,08 mg | 80 mg | 104 mg | 431 mg | 1 600 mg |
| Fer | 2,13 mg | 1,64 mg | 0 mg | 0 mg | 1,67 mg | 5 mg | 30 000 mg |
| Magnésium | 114 mg | 84,2 mg | 0,019 mg | 22 mg | 111 mg | 243 mg | 366 mg |
| Zinc | 0,984 mg | 0,877 mg | 0,001 mg | 0,5 mg | 0,6 mg | 3,57 mg | 5,36 mg |
| Fruits‚ légumes‚ noix et huiles de colza‚ noix et olive | 38,7 % | 39,3 % | 0 % | 0 % | 23 % | 98 % | 100 % |
| Fruits‚ légumes et noix - séchés | 0 % | 0 % | 0 % | 0 % | 0 % | 0 % | 80 % |
| Fruits‚ légumes‚ noix et huiles de colza‚ noix et olive (estimation manuelle avec la liste des ingrédients) | 66,9 % | 28,9 % | 0 % | 15 % | 77 % | 98 % | 100 % |
Pays : France - Voir les produits correspondants du monde entier
11 666 produits
-
TUC Original - 100 g

-
Monaco - Belin - 100 g
-
Pringles Original - 175 g

-
Lightly sea salted crisps - Tyrrell's - 150 g
-
Sour Cream & Onion - Pringles - 175 g

-
Lay's Cuites au four nature - 130 g
-
Chipster - Belin - 75 g
-
Chargement… - pringles - 165 g

-
Pistaches de Californie - Alesto - 250 g

-
Tuc original - Mondeléz International - 100 g
-
Sticks et bretzels d'Alsace - ANCEL - 300 g

-
Natur' & Bon - Chips de lentilles saveur fines herbes - 85 g

-
Snack poppé T&H - Too GoodFrance - 85 g ℮
-
Original - Pringles - 165g
-
Chips saveur fromage du Jura - Bret's - 125 g
-
Saveur Barbecue - TOO GOOD - 85g
-
Emmental & graines de courge - DR KARG'S - 200 g
-
Sticks Bretzels d'Alsace L'original - DR. OETKER - 300g

-
Lay's Recette paysanne nature - 155 g
-
Chips de lentilles saveur tomate mozza - Vico - 85g ℮

-
Lightly Salted Low Fat Corn Cakes - Kallo

-
Cacahuètes - grillées & salées - Alesto - 250 g
-
Espelta crackers - Bachman - 240 g
-
Flutes aux 3 graines - Kambly - 125 g
-
Cacahuètes grillées non salées - Alesto - 200 g
-
Pomme de terre nature - Lay's - 155 g
-
Pringles original - 195 g
-
sea salt & cider vinegar chips - Tyrrell’s - 150 g e

-
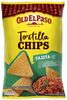
Tortilla Nachips Original - Old El Paso - 185 g
-
Taboulé Oriental Menthe - Bonduelle - 300 g

-
Crackers heudebert - 250 g
-
Sticks et Bretzels d'Alsace - Ancel - 137 g
-
Pringles Sour Cream Onion - 165g
-
La Chips de Sarrasin au Sel de Guérande - Brets - 120 g e
-
Soleti - Zlatna Dobrudzha - 60g

-
Mélange de noix et d'olives - Alesto - 200g
-
Bretzels d'Alsace maxi - Ancel - 200 g

-
Bacon - LU - 100g
-
Pringles Hot & Spicy - 175 g

-
Céleri rémoulade - Saladinettes - 500 g

-
Pringles Paprika - 165 g
-
Curly cacahuète l'original - Vico - 160 g
-
Noix de cajou - Alesto - 150 g
-
Bio crackers - maître Jean pierre - 200 g

-
Curly Cacahuète Original - Vico - 100 g

-
Bio Crackers - MAÎTRE JEAN PIERRE - 200g
-
Doritos - 170 g

-
Pringles - 40g

-
Bio crackers - Lidl - 200 g

-
ROUGH OATCAKES - Nairn's - 10
-
Rice Crackers Finement Salé - N/A - 85 g
-
Vico Extra Craquantes - 400 g
-
Chips saveur Chèvre piment d'Espelette - Brets - 125 g
-
Triangolini Sésame - Belin - 100 g
-
Préparation Taboulé menthe citron - Tipiak - 350 g
-
Chips saveur Sel & Vinaigre - Bret's - 125 g
-
Chips - Vico - L'extra craquante nature - 150 g
-
Paprika - Pringles - 175 g

-
Nairn's Super Seeded Organic Oatcakes - Nairns - 200 g
-
Tuc original - Biscuits salé - LU - 75 g e

-
Mélange de noix et pistaches - Alesto - 200 g
-
Tartine Croustillante - Schär - 4
-
Chips saveur barbecue - Lay's - 135 g
-
Formule boost - Daco Bello - 200 g
-
Mélange japonais - Maître Prunille - 250 g e
-
Carottes râpées Au jus de citron* - Carrefour - 300 g

-
Nairn's Cheese Oatcakes - Nairns - 200 g

-
Minizza Tomate & Herbes de Provence - Belin - 85 g
-
coleslaw - Bonduelle - 320 g

-
Chips Craquante Sel Brets - Bret's - 125 g ℮

-
Crackers - Carr's - 125g

-
Chips paysanne nature - Lay's - 295 g

-
Chips sel de mer et poivre noir - Tyrrell’s - 150g
-
Mon taboulé au poulet à la ciboulette - Pierre Martinet - 500 g

-
Crackers - Ritz Crackers - 200 g

-
Monster Munch Salé - Vico - 85 g

-
Cream Crackers Original and Best - Jacob’s - 300 g
-
Mini mix - Gullón - 350 g

-
Coleslaw, choux blanc et carottes - Saladinettes (LiDL) - 500g
-
Sweet Chilli & Red Pepper - Tyrrell’s - 150g

-
Sour cream & onion - Pringles - 195 g

-
Sour Cream & Onion - Pringles - 36 g.

-
Multi grain - Ryvita - 250 g
-
Ancel Bretzel d’Alsace Mini - DR. OETKER - 100 g

-
Chips saveur Poulet Braisé - Bret's - 125 g e
-
Mature Cheddar & Chive - Tyrell's - 150 g
-
Crackers - Schär - 210 g (6 x 35 g)
-
Crackers Aux graines de courge, lin et sésame - Carrefour - 175 g
-
Petits sablés Beaufort - Michel et Augustin - 100 g
-
Les Bretzels du soleil - ancel - 300 g

-
Taboulé au poulet à la ciboulette - Pierre Martinet - 300 g
-
Petits beurre Comté et poivre noir de Madagascar - Michel et Augustin - 100 g

-
Tortilla chips - Old El Paso - 185 g
-
Riz à la Provençale au Thon & Basilic - Bonduelle - 320 g

-
Bastoncini salati - Snack day - 250 g

-
Macédoine de légumes en conserve - Bonduelle - 400 g

-
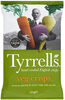
Veg crisps - Tyrrell's - 150 g e
-
Grissini Artigianali Romarin - Florelli - 300 g

-
3D's Bugles goût nature - Lay's - 85 g

-
Chips nature Maxi Format - Pom'Lisse - 350 g
