Desserts lactés
Fait partie de :
Contient :
- Crèmes dessert
- Crèmes catalanes
- Crèmes brûlées
- Cuajada
- Crèmes aux œufs
- Desserts lactés au chocolat
- Mousses lactées
- Desserts lactés fermentés
- Flans gélifiés
- Gâteau au fromage blanc
- Laits emprésurés
- Panna cottas
- Semoules au lait
- Gâteau au yaourt
- Desserts lactés à la vanille
- Desserts lactés au café
- Desserts lactés aux œufs
- Gâteaux de riz
- Gâteaux de semoule
- Oeufs au lait
Tableau nutritionnel
Composition nutritionnelle moyenne pour les 13743 produits de la catégorie Desserts lactés dont les informations nutritionnelles sont connues (sur un total de 14884 produits).
| Tableau nutritionnel | Tel que vendu pour 100 g / 100 ml |
Ecart type | Minimum | 10ème centile | Médiane | 90ème centile | Maximum |
|---|---|---|---|---|---|---|---|
| Énergie |
447 kj (106 kcal) |
158 kj (38 kcal) |
0 kj (0 kcal) |
252 kj (60 kcal) |
410 kj (98 kcal) |
745 kj (178 kcal) |
14 200 kj (3400 kcal) |
| Matières grasses | 4,18 g | 2,76 g | 0 g | 0,5 g | 3,3 g | 9,7 g | 92 g |
| Acides gras saturés | 2,65 g | 1,83 g | 0 g | 0,1 g | 2,1 g | 6,2 g | 26 g |
| Acides gras monoinsaturés | 1,07 g | 0,85 g | 0 g | 0 g | 0,9 g | 2,7 g | 5,14 g |
| Acides gras polyinsaturés | 0,329 g | 0,417 g | 0 g | 0,001 g | 0,2 g | 1,3 g | 1,74 g |
| Acides gras Oméga 3 | 30,7 mg | 14,6 mg | 0 mg | 9 mg | 30 mg | 68 mg | 54 000 mg |
| Acide alpha-linolénique | 0,107 g | 0,036 g | 0 g | 0,09 g | 0,12 g | 0,14 g | 15 g |
| Acides gras trans | 0,011 g | 0,029 g | 0 g | 0 g | 0 g | 0,1 g | 0,2 g |
| Cholestérol | 6,73 mg | 5,58 mg | 0 mg | 0 mg | 6 mg | 16 mg | 50 mg |
| Glucides | 12,2 g | 5,3 g | 0 g | 4 g | 12,8 g | 20,7 g | 100 g |
| Sucres | 10,9 g | 4,61 g | 0 g | 3,53 g | 11,9 g | 18 g | 92,3 g |
| Lactose | 0,562 g | 1,09 g | 0 g | 0 g | 0,1 g | 3,8 g | 4,1 g |
| Maltodextrines | 0,078 g | 0,068 g | 0 g | 0 g | 0,096 g | 0,204 g | 0,24 g |
| Fibres alimentaires | 0,34 g | 0,484 g | 0 g | 0 g | 0,1 g | 1,43 g | 74 g |
| Protéines | 4,27 g | 1,48 g | 0 g | 2,7 g | 3,8 g | 7,5 g | 66 g |
| Sel | 0,124 g | 0,038 g | 0 g | 0,08 g | 0,11 g | 0,2 g | 28 g |
| Alcool | 0,328 % vol | 0,577 % vol | 0 % vol | 0 % vol | 0 % vol | 1,5 % vol | 6,5 % vol |
| Vitamine A (rétinol) | 81,3 µg | 60,8 µg | 0 µg | 0 µg | 99,9 µg | 183 µg | 106 000 µg |
| Vitamine D | 1,31 µg | 0,874 µg | 0 µg | 0,75 µg | 1,2 µg | 2,9 µg | 5 000 000 µg |
| Vitamine C (acide ascorbique) | 2,92 mg | 4,39 mg | 0 mg | 0 mg | 1,1 mg | 13 mg | 115 mg |
| Vitamine B1 (Thiamine) | 0,334 mg | 0,302 mg | 0,17 mg | 0,17 mg | 0,23 mg | 1,22 mg | 2,4 mg |
| Vitamine B2 (Riboflavine) | 0,238 mg | 0,109 mg | 0 mg | 0,13 mg | 0,21 mg | 0,49 mg | 2,2 mg |
| Vitamine B6 (Pyridoxine) | 43,9 mg | 82,7 mg | 0,21 mg | 0,21 mg | 0,28 mg | 210 mg | 750 mg |
| Vitamine B9 (Acide folique) | 97,2 µg | 95,1 µg | 28 µg | 30 µg | 58 µg | 308 µg | 30 000 000 µg |
| Vitamine B12 (cobalamine) | 0,611 µg | 0,686 µg | 0,12 µg | 0,27 µg | 0,4 µg | 3,4 µg | 240 µg |
| Potassium | 166 mg | 73,1 mg | 0 mg | 77 mg | 160 mg | 280 mg | 6 000 mg |
| Calcium | 134 mg | 24,1 mg | 0 mg | 106 mg | 122 mg | 180 mg | 160 000 mg |
| Phosphore | 126 mg | 75,5 mg | 0 mg | 59 mg | 110 mg | 240 mg | 625 mg |
| Fer | 0,636 mg | 1,58 mg | 0 mg | 0 mg | 0 mg | 4,28 mg | 2 100 mg |
| Magnésium | 46,6 mg | 35,7 mg | 10 mg | 18 mg | 30 mg | 146 mg | 380 mg |
| Zinc | 2,23 mg | 2,41 mg | 1,2 mg | 1,5 mg | 1,5 mg | 12 mg | 1 500 mg |
| Fruits‚ légumes‚ noix et huiles de colza‚ noix et olive | 4,4 % | 4,22 % | 0 % | 0 % | 5 % | 10,8 % | 32,1 % |
| Fruits‚ légumes‚ noix et huiles de colza‚ noix et olive (estimation manuelle avec la liste des ingrédients) | 8,15 % | 2,68 % | 0 % | 3,75 % | 8 % | 12,1 % | 68,3 % |
| Cacao (minimum) | 14,3 % | 17,8 % | 0,1 % | 1 % | 2,9 % | 51 % | 70 % |
Pays : France - Voir les produits correspondants du monde entier
14 467 produits
-
Yaourt
-
Fromage blanc nature 0% MG - Prix Mini - 1 kg
-
Yaourt infusé au basilic sur lit de fraise - Le Fromager Des Halles

-
Yaourt Brassé - Monoprix Gourmet
-
Oeufs au lait à la vanille sur lit de caramel - Ibaski
-
Mousse chocolat au lait

-
Flan épais

-
Fromage blanc nature - U - 500 g

-
Yaourt a boire a la fraise - 250 g

-
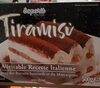
Tiramisu - Thiriet

-

-
Skyr nature - Pâturages - 4 x 100 g
-
Tiramisu - Metro Chef
-
Flanby
-
Yaourt brassé citron et arôme naturel de menthe - Monoprix

-
Crème dessert caramel - Ferme de Kerheu - 500 g

-

-
-
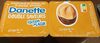
danette - Danone
-
Velouté yaourt aux bons fruits mixés - Danone - 8 x 125 g
-

-
Yaourt de brebis bio Vanille
-
Yaourt aux fruits - Beillevaire - 125 g
-
Yaourt grecque

-
Yaourt Fermier aux fruits - 500 g

-
Creme dessert vanille - Lait du Forez - 100 g

-
Danomino - Danone

-
Danette double saveur, caramel salé et chocolat - 4 x 125 g
-
400 g
-
yaourt au lait de brebis - GAEC La binocle

-
Skyr au lait de brebis vanille - Le Petit Basque

-
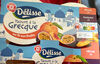
délisse yaourt à la grecque sur lit aux fruits
-
-
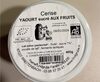
Yaourt sucré aux fruits -
-
Yaourt Brassé Artisanal - Laiterie la Côtière - 500 g
-
500 g

-
crème dessert caramel - 4 x 100 g
-
Smoothie with yoghurt

-
Fromage blanc - Milsani

-
Tiramisu - Saporit
-
Bande flan

-
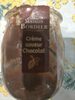
Crème dessert chocolat - Envia - 4 x 125 g

-
Tiramisu biologique

-
Danette le liégeois

-
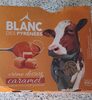
Yaourt artisanal - Blanc des Pyrénées - 500gr

-
Crème dessert saveur chocolat
-
Fromage blanc au lait demi écrémé - Eco+ - 1 kg

-

-
yaourt fermier
-
Faisselle fermière d'Ardeche - - 500 g
-
Mousse au chocolat - L'Éclair de Génie

-
Fromage blanc - 200 g
-
Mousse au chocolat noir - Monoprix
-
Yaourt aromatisé

-
Séré - Bio natur plus - 125 g

-
Bande flan nature - E.Leclerc
-
Délisse
-
Flan Pâtissier

-
-
Flan

-
Joghurt Dessert

-
Yahourt aux fruits - Panier de Yoplait - 6 x 125 g

-
HiPRO Saveur Mangue - Danone

-
-
Sojasun framboise passion

-
Spécialité laitière Mangue - Envia - 400 g

-
Frais malo mangue passion - 4 x 100 g
-
Danette saveur madeleine - Danone - 4 x 125 g

-
DeliMax

-
Fromage blanc nature - Paysan Breton

-
Fromage blanc 0% - Envia
-
Yaourts Aromatisés

-
Bonne Maman rhubarbe et yaourt

-
Flan saveur chocolat - 8 x 100 g

-
SKYR brebis châtaigne AOP d'Ardèche - PUFFY'S - 250g
-
Flan coco

-
Flan epais nature -
-
Mon Yaourt au Lait Entier - Petit Breton - 5 kg

-
La faiselle - Rians - 400 g
-
Danette double saveurs coco & chocolat - 500 g (4x125g)

-
-
Plaisir bio caramel
-

-
Fromage blanc au lait de brebis
-
Nesquik petit

-
Yaourt au lait entier - Monoprix - 16 x 125 g

-
Gâteau de riz - La Laitière - 500 g

-
Bande flan -

-
SKYR - Envia

-
Yaourt gourmand orange chocolat - Alsace lait
-
Yaourt fermier aux fruits - 4 x 125 g

-
Fruit yogurt drink - 500 ml

-
HIPRO + Mangue Passion - Danone - 2 x 160 g
-
Skyr à boire - Danone

-
Fromage de chevre fermier faisselle - 6 x 125 g
-
Yaourt saveur fraise - Cazaubon
-
Skyr à boire
-
Perch'en yaourt brassé nature

-
Brassé riche en protéines vanille - Yoplait

-
Yaourt à la Fleur de Sureau - Fromaville